End to end correlation using Azure application insights for asp.net mvc apps
I have been working with Azure application insights for some time now and its now that I am realizing its full potential. Traditionally we all have worked with applications logging in databases or flat files and felt the pain of debugging issues using those. Application Insights is a full-scale application performance monitoring tool which does much more than only logging.
In this blog, I will discuss how to use end to end correlation of requests using application insights for an asp.net MVC application.
Pre-requisites
You should have application insights enabled for your application. It’s as simple as installing a NuGet package. You can go through the steps mentioned here.
What is end to end correlation
Let’s assume a typical application scenario with a web frontend and a couple of services. So web application issues Ajax requests to web backend which in turn may call multiple other APIs. With microservices architecture becoming popular, this kind of scenario is quite common nowadays
Issue with such a setup is that there can be errors or exceptions at any of the interfacing points e.g. there could be an exception that might occur at one of the downstream services and it becomes really hard to figure out what caused the exception and how the whole flow of request happened from service to service which caused this exception.
This is where end to end correlation helps which shows you an hierarchical view of the request flow telling which service or API calls happened along with where and at what point exception occurred along with all the logs / traces that happened during that request.
What is does
Lets take a simple scenario for an Asp.net MVC application interacting with a couple of asp.net Web APIs.
Browser –[Calls]–> MVC application —[Calls]–> API-1 –[Calls]–> API-2
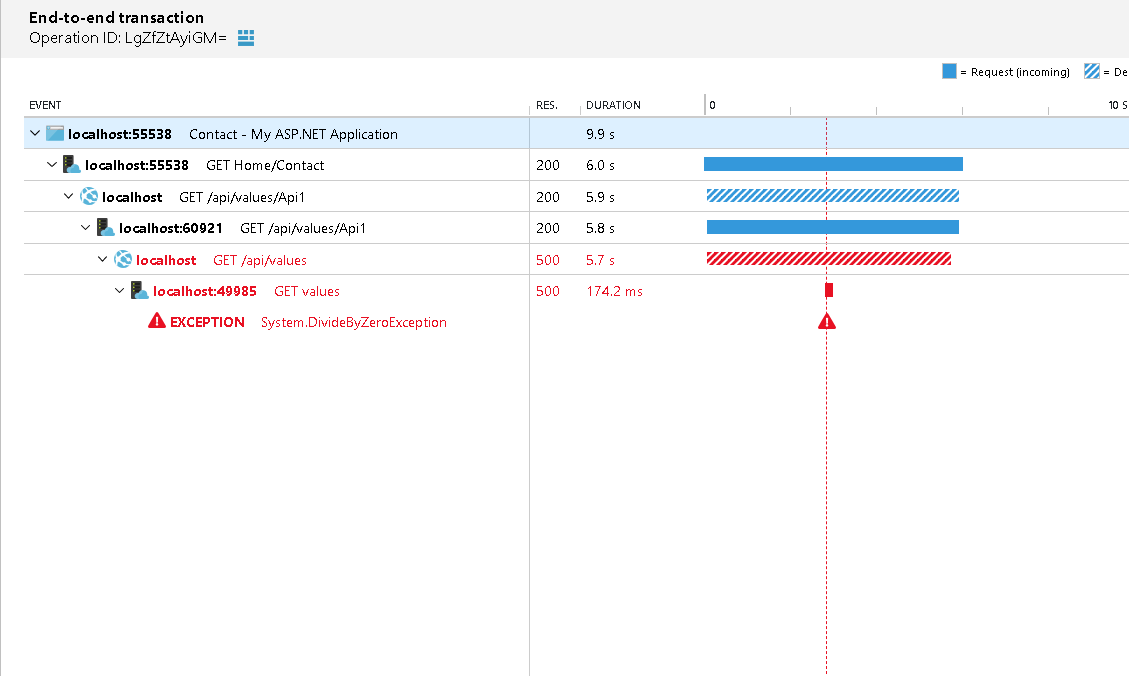
Below is how these calls are correlated and shown in application insights

Explanation
- At the top, you see the page which you viewed in the browser (in this Contact page).
- This page issued a call to MVC backend to get the page content i.e. GET Home/Contact.
- Contact action method in MVC application in turn calls API1 to get some content information which is shown as outgoing dependency and then the same request is registered on the API side as an incoming request.
- Now API1 calls another API and this is again logged in a similar manner i.e. an outgoing dependency and incoming request.
If Service A calls service B then from point of view of Service A , call to Service B is an ‘Outgoing dependency’ and when this request is received at Service B then from its point of view the call is an ‘Incoming request’ from service A. Thats the reason App insights captures both of them .See the minor difference in duration of the last two calls (dependency and request) in above image.
How to enable correlation
Now that’s the easy part. Correlation works by default when you enable application insight. If you have a simple vanilla setup like discussed above you don’t have to do much except for enabling application insights and it will install all required telemetry modules. Just have a look at the application insights config and you will see where all the magic is happening.
The only thing which we need to add is a below-highlighted line in your client-side script of app insights so that you can correlate the page views to the outgoing server calls.

In case you are using other components such as queues, topics, background jobs etc or if you are using angular frontend this becomes little tricky. In such cases, you might have to do some custom implementation to see correlation across all those components (or use third-party libraries). I will probably discuss those in future posts.
How it works
Correlation works with below three properties which are associated with each of the telemetry logged in app insights
- Operation Id: This property represents a whole logical operation like the call hierarchy shown above and this Id should be same for all the activities taking place during one logical operation
- Id: These are unique identifiers for individual telemetry entries logged in app insights.
- Parent Id : This is used to establish parent child relationship among telemetry. e.g. Page View is the parent of dependency GET /api/values/Api1 and later in turn is the parent of request GET /api/values/Api1 .
Lets see how it looks for our above example.

and incase there are exceptions below is how you would spot exceptions and where it happened.
and below is the whole hierarchy and parent-child relationship.
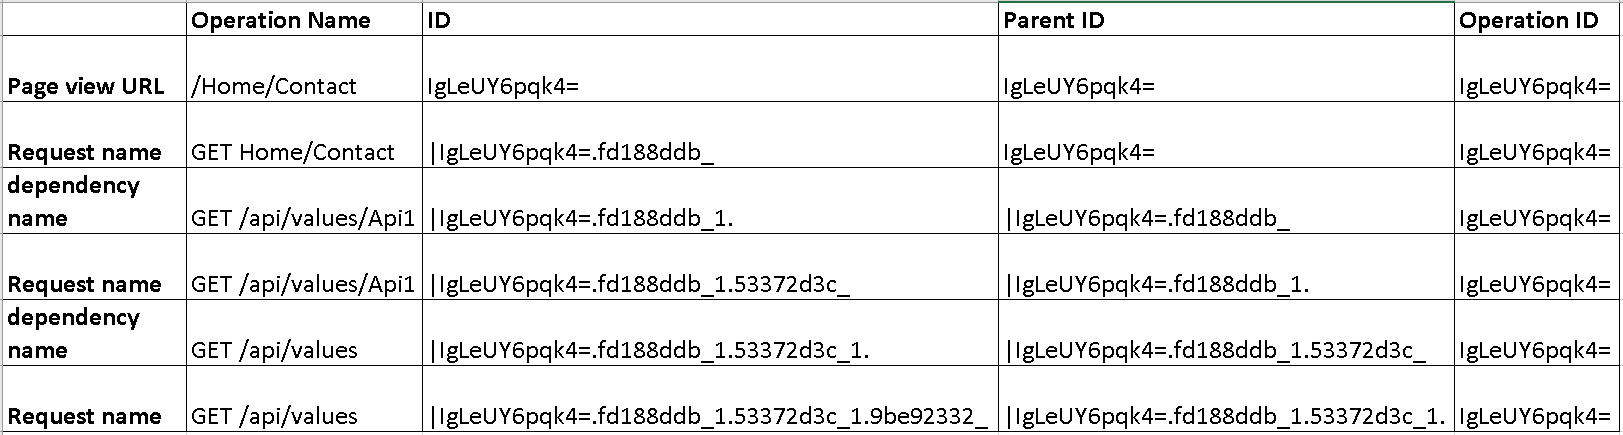
Notice how the Id and parent Id are generated. Each telemetry above act as the parent of one below and that is how this whole correlation is established.
All this comes out of the box for a vanilla MVC and web API applications but in case if you are doing something more and need correlation than it’s your responsibility to generate Id and parent Id appropriately.
Another interesting thing to notice is the format of IDs being generated. Each subsequent child ID is generated by adding something to the parent id. This is the default ID generation strategy used by app insights and is based on ‘Hierarchial Request-Id’ format of Http correlation protocol.
If you are looking at advanced monitoring and application performance management for Azure resources and web applications look at this pluralsight course. It also talks about enabling application insights and much more.
“if you are using angular frontend this becomes little tricky. In such cases, you might have to do some custom implementation to see correlation across all those components (or use third-party libraries). I will probably discuss those in future posts.”
Did you ever write this blog post? Or can you guide me towards what that custom implementation might involve for Angular frontend?
Thanks in advance!
Nice quick summary. Thanks!