Using snapshot debugger with application insights
Application insights is a great offering from microsoft for monitoring your applications. Using snapshot debugger further enhances capabilities of app insights and give you much more power in resolving issues which might be occurring on your production application.
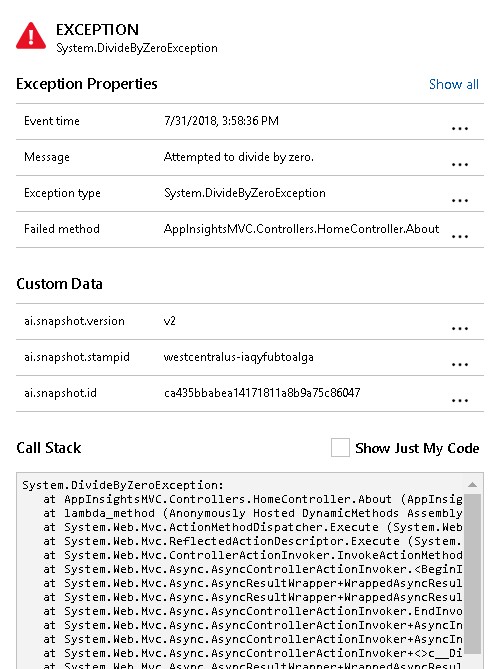
App insights by default logs all high level details for the exceptions that occur in your application.Usually it would look like below for a simple divide by zero scenario.These are useful details to move you towards root cause of the problem but not enough.Its not the same experience as you would have had when exception would have occurred on you local dev environment while debugging.

How does snapshot debugger works
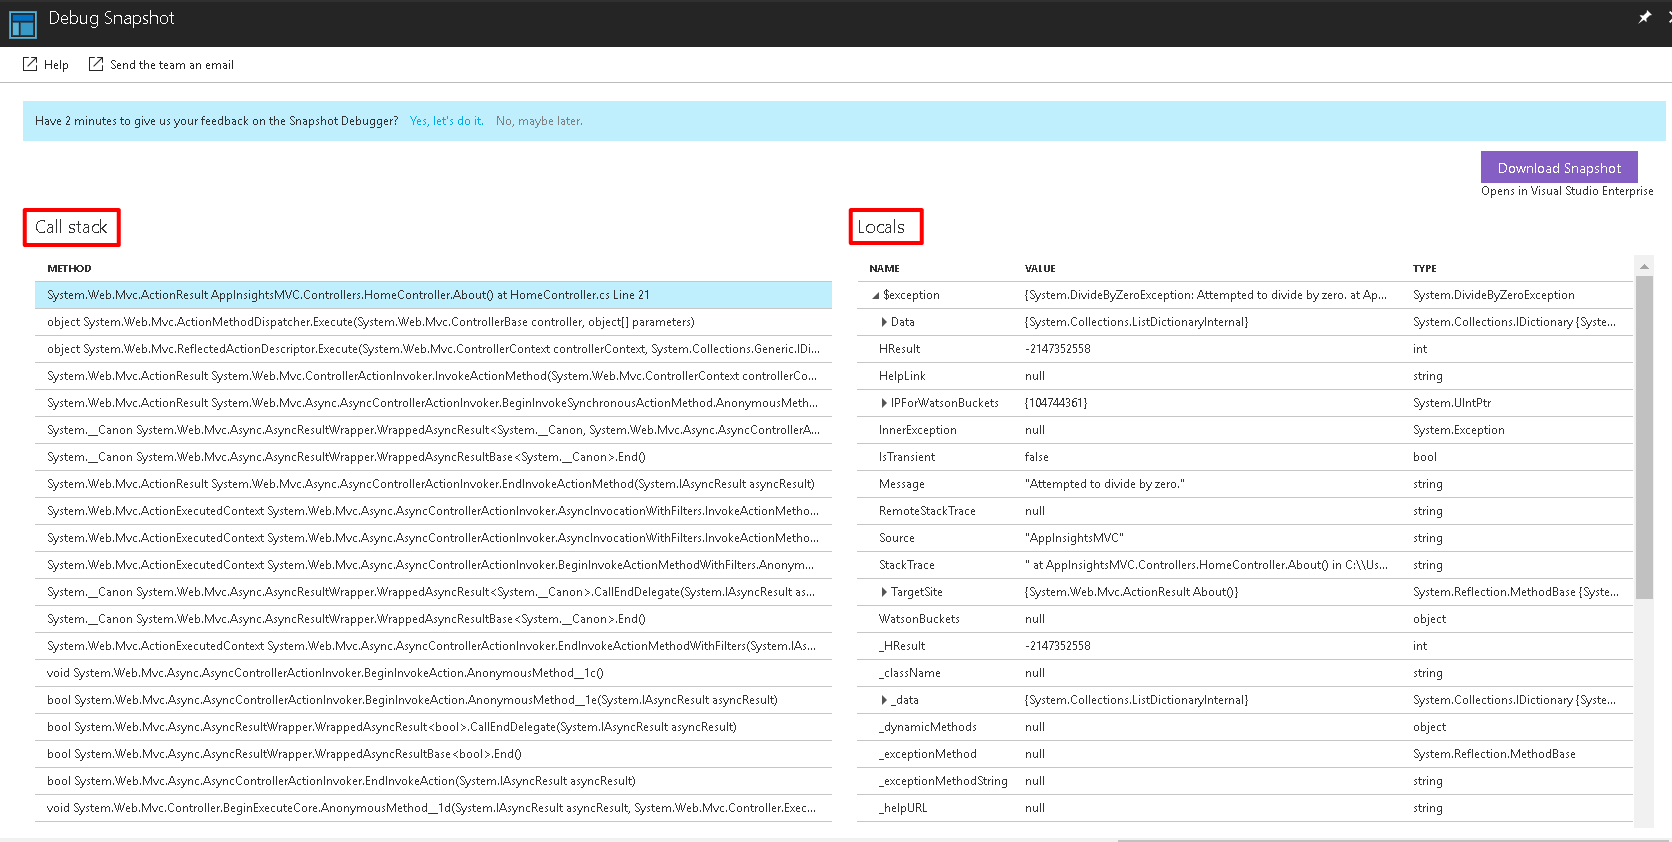
Snapshot debugger tries to provide you with similar experience as local debugging for your production applications.Basically with snapshot debugger enabled, same exception has much more information (apart from what you had by default ) and looks something like below.
Basically it provides you details of all your locals ,stack trace etc i.e. all the details provided during your local debugging sessions.
Its like a snapshot taken at the moment in time when exception occurred. If this is not good enough you can also open this snapshot in visual studio and look at all the details similar to how you would have done when during a local debugging session.
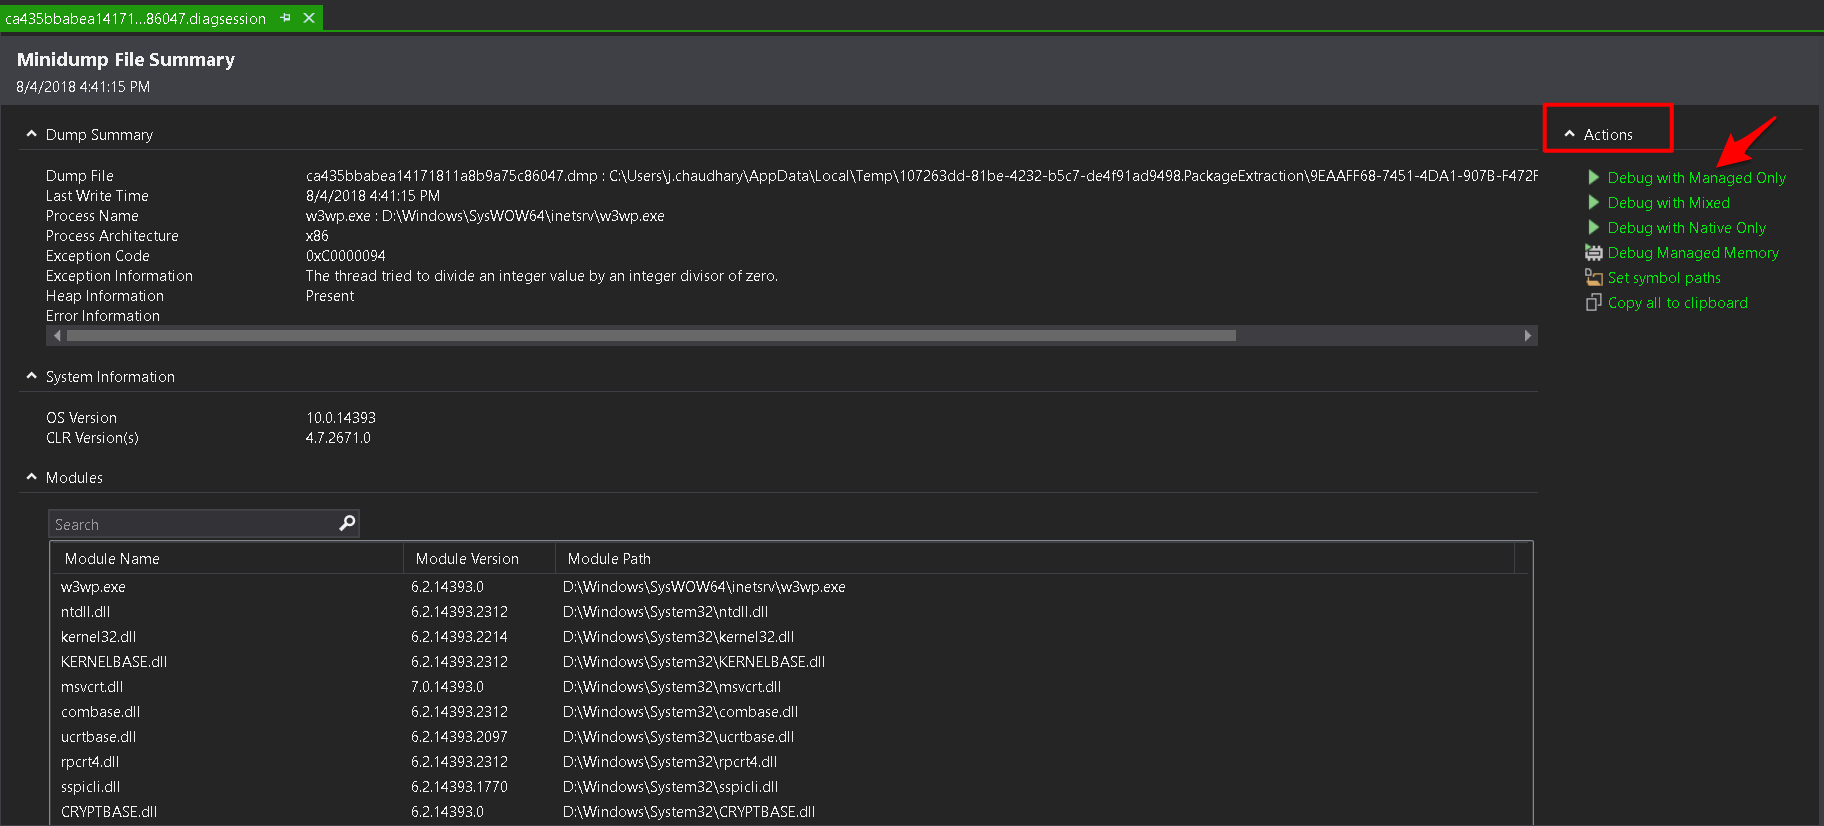
Just click on the ‘Download Snapshot’ button and a ‘.diagsession’ file will be downloaded to your system. This file can be opened with visual studio and it opens the minidump for the application downloaded from production app.

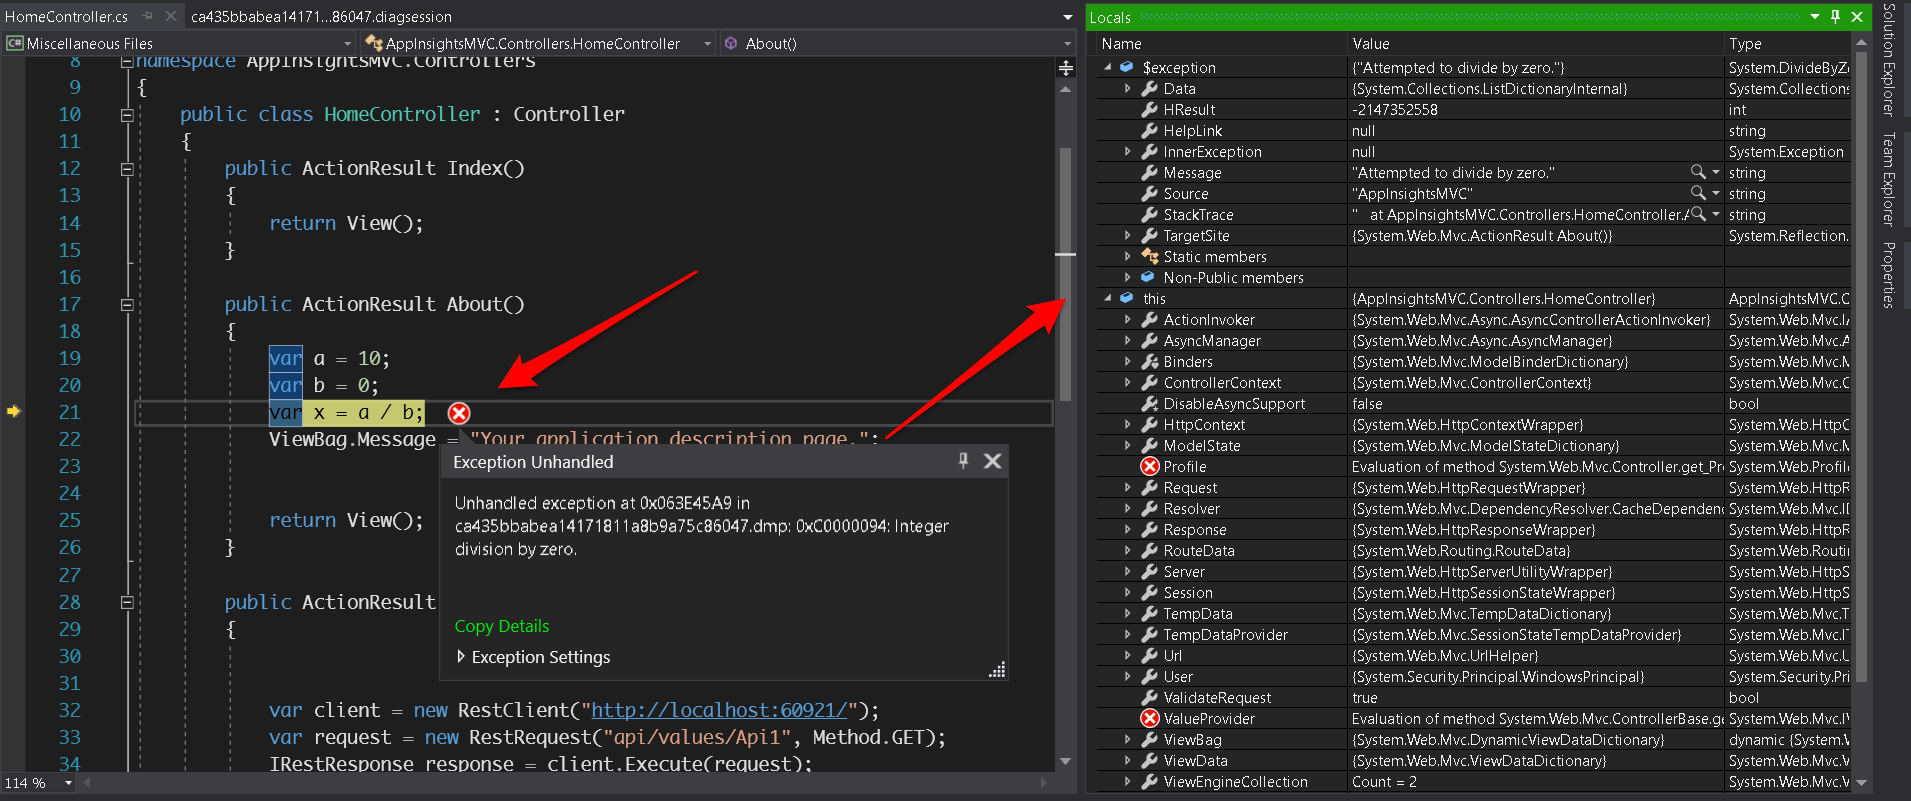
There are couple of options under actions,Just click on ‘Debug with Managed Only’ and you would see familiar debugging breakpoint at the location where exception has occured.

You can hover on variables and look for their values or also get into all the exception details.
How to enable snapshot debugger
Usually in my blogs I explain how to do something and then show the output but in this case i did exact opposite because ‘How to’ part is so very simple in this case.
If your application already has app insights enabled then you just have to install one nuget package namely i.e. Microsoft.ApplicationInsights.SnapshotCollector which will do some changes to your applicationinsights.config and your are ready to go.

Although this feature is now generally available but not many people have used it as such .My recommendation would be to enable it for sure as this does not have any performance impact on the application and is very simple to enable.
If you are looking at advanced monitoring and application performance management for Azure resources and web applications look at this pluralsight course. It also talks about enabling application insights and much more.
